May 2022 - SMMT CV Analysis
Analysing the biggest trends in commercial vehicles…
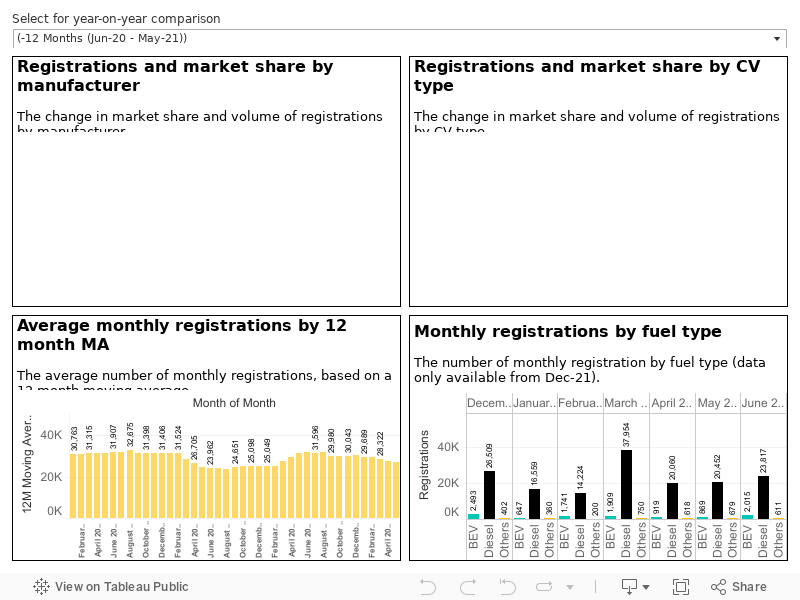
To see how changes in the industry are impacting the mix of fuel types, vehicle types and brands’ sales performance, please compare the data year-on-year below.
Interpreting data correctly is key to driving intelligent business decisions. In this Tableau dashboard, which takes data from the Society of Motor Manufacturers and Traders (SMMT), we identify the trends impacting the automotive sector.
Highlights.
Ford remains the dominant manufacturer, with 114,868 registrations in the last 12 months, equating to a 35.5% market share. Compared with the previous 12-month period, Ford’s registrations fell by 9.3k, a 7.5% drop. However, due to the market contracting 17.0% year-on-year, Ford’s market share actually increased by 2.3%.
All of the ‘top 10’ manufacturers have seen a year-on-year decline in volume (due to supply issues) with the exception of Toyota, which saw registrations and market share increase by 1,155 units and 0.9% respectively.
What stands out most to us is the emergence and growth of challenger brands. Chinese manufacturer, Maxus, only entered the market in September 2020 (albeit via a rebrand of British manufacturer LDV). However, with a competitive price point and affordable EVs, its sales have grown exponentially. Registrations increased by almost sevenfold, from 619 to 4,859 units, while market share increased from 0.2% to 1.5%. Maxus now sits just outside the top 10, in 11th.
Vans between 2.5t and 3.5t saw the biggest decline in registrations, down 23,396 units compared with the previous 12-month period - a 9.5% decline. Despite this decline, large vans market share actually increased by 4.1%, as the decline in the overall market was greater - 14.8%.
All other commercial vehicle types declined in both volume of registrations and market share.
In May-21, a 12month view of the market would have shown a strong recovery in registrations to pre-pandemic levels. However, due to chip supply shortages, the market contracted 14.5% in the last 12 months, by comparison. The market for May-22, is 24.6% down compared to May-21. March-22 was 38.5% down compared to pre-pandemic May-19.
Want to hear more?
To receive regular insight, updates and advice, simply sign up to our newsletter.